Automatic Excel report with Pandas and XlsxWriter
Excel spreadheets are very useful for organizing and displaying data, however, creating the same report every month can be time-consuming. I have always been interested in automation technologies and Python provides many great ways to automize the repetitive tasks such as creating monthly sales reports and aggregating datasets.
In this project, I will create a Python script to process monthly sales data and output an Excel spreadsheet with pivot tables, charts and multiple worksheets.
I will use two main packages, Pandas and XlsxWriter. Pandas is widely used for data analysis and manipulation, while XlsxWriter allows the integration of charts into the Excel files.
Since it is challenging to find public datasets containing company sales data, I will use a publicly available dataset about monthly car sales in Norway. The dataset already contains aggregated data.
Let’s start by importing the necessary modules and exploring the dataset!
import numpy as np
import pandas as pd
import calendar
import datetime
import xlsxwriter
data = pd.read_csv('norway_car_sales_dataset.csv')
data.head()
| Date | Make | Model | Quantity | |
|---|---|---|---|---|
| 0 | 1/1/2007 | Volkswagen | Volkswagen Passat | 1267 |
| 1 | 1/1/2007 | Toyota | Toyota Rav4 | 819 |
| 2 | 1/1/2007 | Toyota | Toyota Avensis | 787 |
| 3 | 1/1/2007 | Volkswagen | Volkswagen Golf | 720 |
| 4 | 1/1/2007 | Toyota | Toyota Corolla | 691 |
data.dtypes
Date        object
Make        object
Model       object
Quantity     int64
dtype: object
data['Date'] = pd.to_datetime(data['Date'])
data.dtypes
Date        datetime64[ns]
Make                object
Model               object
Quantity             int64
dtype: object
data = data.fillna(np.nan)
The scope
Since there are many missing values in the dataset, I decided to focus on the brands with more than 100 datapoints.brands = ['Volkswagen ', 'Toyota ', 'Peugeot ', 'Skoda ', 'Ford ', 'Volvo ',
'Audi ', 'BMW ', 'Mitsubishi ',
'Nissan ']
The content
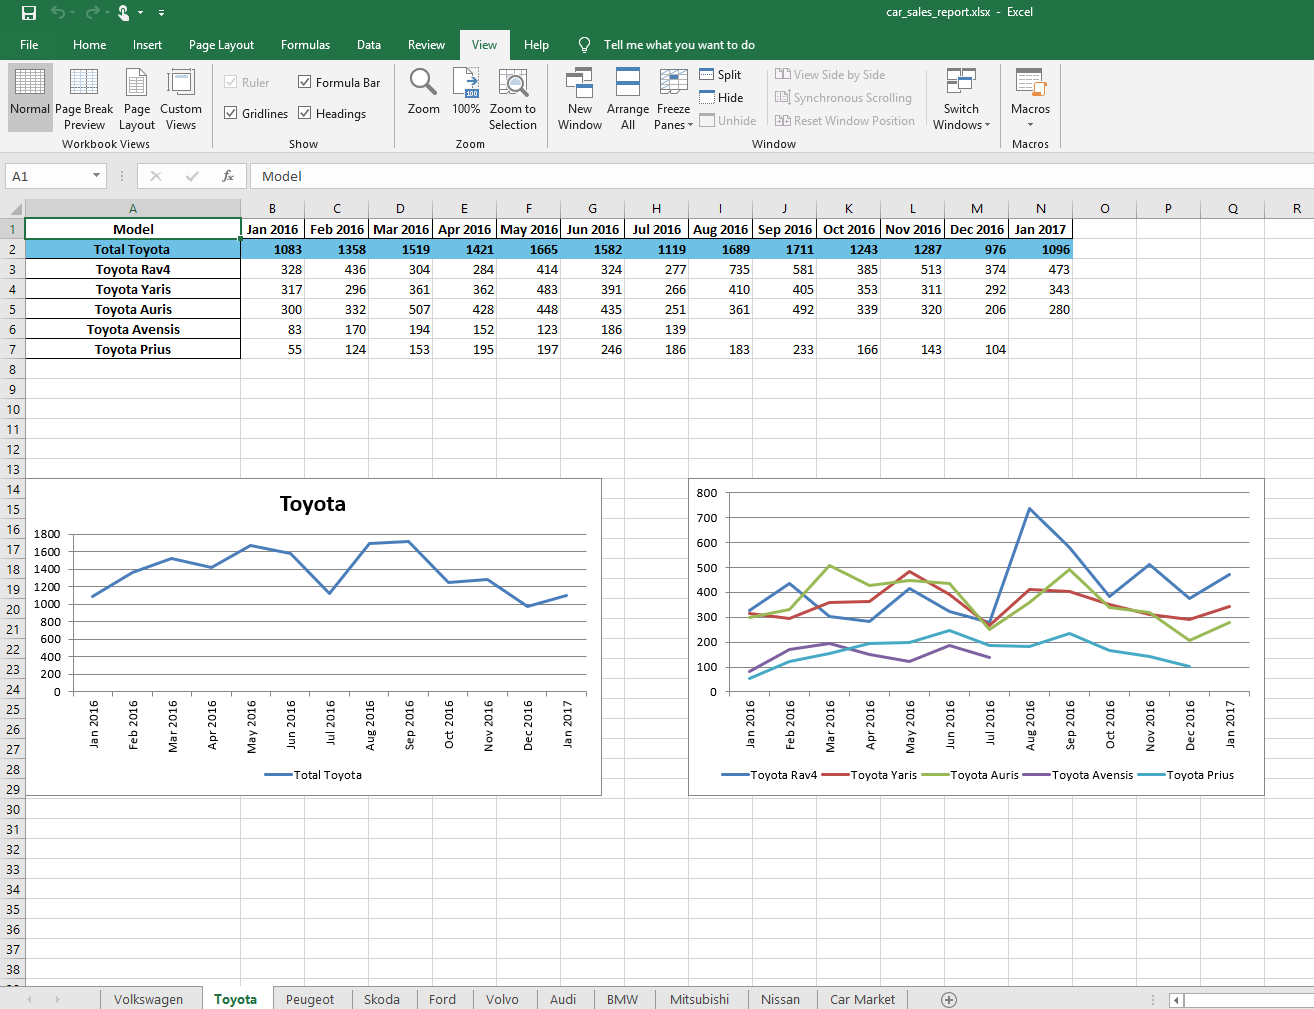
For every brand, the Excle file will contain a worksheet with:- A pivot table summarizing the monthly sales per model and displaying the total sales for the given brand. First, I will filter the database to get information about the given brand and create a pivot table summarizing data about the model, date and quantity sold. The date is converted to month name and year with the calendar and datetime libraries. The table will display sales information between the current month and the same month last year.
- Charts based on the pivot table: Python provides many great graphing modules, however, in this project I decided to create charts with XlsxWriter so the charts can be easily modified in Excel if necessary. The function uses the data created with the previous function. I will use row-column notation because it makes it easier to use loops, however, XlsxWriter also support A1 notations.
def brand_table(brand):
    df = data[data['Make'] == brand]
    pivot = df.pivot_table(index = 'Model', columns = 'Date', values = 'Quantity', aggfunc = sum)

    #Renaming the columns
    columns_list = pivot.columns
    new_columns = []
    for column in columns_list:
        month = datetime.date(column.year, column.month, 1).strftime('%b')
        year = str(column.year)
        new_columns.append(month + " " + year)
    pivot.columns = new_columns

    models = pivot.iloc[:, -13:]
    models = models.dropna(thresh=7)

    last = models.columns[-1]
    models.sort_values(by = [last], axis = 0, inplace = True)
    total = models.sum(numeric_only=True)
    total.name = 'Total ' + brand
    global model_table
    model_table = models.append(total)
    model_table = model_table[::-1]
    return model_table

def monthly_sales_chart(offset, row_plus, position):
    chart2 = workbook.add_chart({'type': 'line'})

    # Configure the series of the chart from the dataframe data.
    for i in range(len(cat_1)-offset):
        row = i + row_plus
        chart2.add_series({
            'name': [brand, row, 0],
            'categories': [brand, 0, 1, 0, 13],
            'values':     [brand, row, 1, row, 13],
        })

    chart2.set_legend({'position': 'bottom'})
    chart2.set_x_axis({'num_font':  {'rotation': -90}})

    # Insert the chart into the worksheet.
    worksheet.insert_chart(position, chart2, {'x_scale': 1.2, 'y_scale': 1.1})
The Excel file
writer = pd.ExcelWriter('car_sales_report.xlsx', engine='xlsxwriter')
for brand in brands:
    brand_table(brand)
    cat_1 = model_table.index

    model_table.to_excel(writer, sheet_name=brand)
    workbook  = writer.book
    worksheet = writer.sheets[brand]

    cell_format = workbook.add_format()
    cell_format.set_bg_color('#6ec1e4')
    bold = workbook.add_format({'bold': True})

    worksheet.conditional_format(1, 0, 1, 13, {'type': 'no_errors', 'format': bold})

    worksheet.conditional_format(1, 0, 1, 13, {'type': 'no_errors', 'format': cell_format})

    worksheet.set_column('A:A', 30)

    chart = workbook.add_chart({'type': 'line'})

    # Configure the series of the chart from the dataframe data.
    chart.add_series({'name':[brand, 1, 0],
                      'categories': [brand, 0, 1, 0, 13],
                      'values': [brand, 1, 1, 1, 13],
                      'labels': {'series_name': True,
                                 'position': 'center'}})
    chart.set_legend({'position': 'bottom'})
    chart.set_title ({'name': brand})
    chart.set_x_axis({'num_font':  {'rotation': -90}})

    # Insert the chart into the worksheet.
    worksheet.insert_chart('A14', chart, {'x_scale': 1.2, 'y_scale': 1.1})

    monthly_sales_chart(1, 2, 'I14')
The output
 ;
;
by_make = data[data['Make'].isin(brands)]

pivot_by_make = by_make.pivot_table(index = 'Make', columns = 'Date', values = 'Quantity', aggfunc = sum)
columns_list = pivot_by_make.columns
new_columns = []
for column in columns_list:
    month = datetime.date(column.year, column.month, 1).strftime('%b')
    year = str(column.year)
    new_columns.append(month + " " + year)
pivot_by_make.columns = new_columns

summary = pivot_by_make.iloc[:, -13:]
summary = summary.dropna(thresh=7)

sums = summary.sum(numeric_only=True)
sums.name = 'Total '
global summary_table
summary_table = summary.append(sums)
last = summary_table.columns[-1]
summary_table.sort_values(by = [last], axis = 0, ascending = False, inplace = True)

brand = 'Car Market'

summary_table.to_excel(writer, sheet_name=brand)
workbook  = writer.book
worksheet = writer.sheets[brand]

cell_format = workbook.add_format()
cell_format.set_bg_color('#6ec1e4')
bold = workbook.add_format({'bold': True})

worksheet.conditional_format(1, 0, 1, 13, {'type': 'no_errors',
                                      'format': bold})

worksheet.conditional_format(1, 0, 1, 13, {'type': 'no_errors',
                                      'format': cell_format})

worksheet.set_column('A:A', 30)

chart = workbook.add_chart({'type': 'line'})

chart.add_series({'name':[brand, 1, 0],
                  'categories': [brand, 0, 1, 0, 13],
                  'values': [brand, 1, 1, 1, 13],
                  'labels': {'series_name': True,
                             'position': 'center'}})
chart.set_legend({'position': 'bottom'})
chart.set_title ({'name': brand})
chart.set_x_axis({'num_font':  {'rotation': -90}})

# Insert the chart into the worksheet.
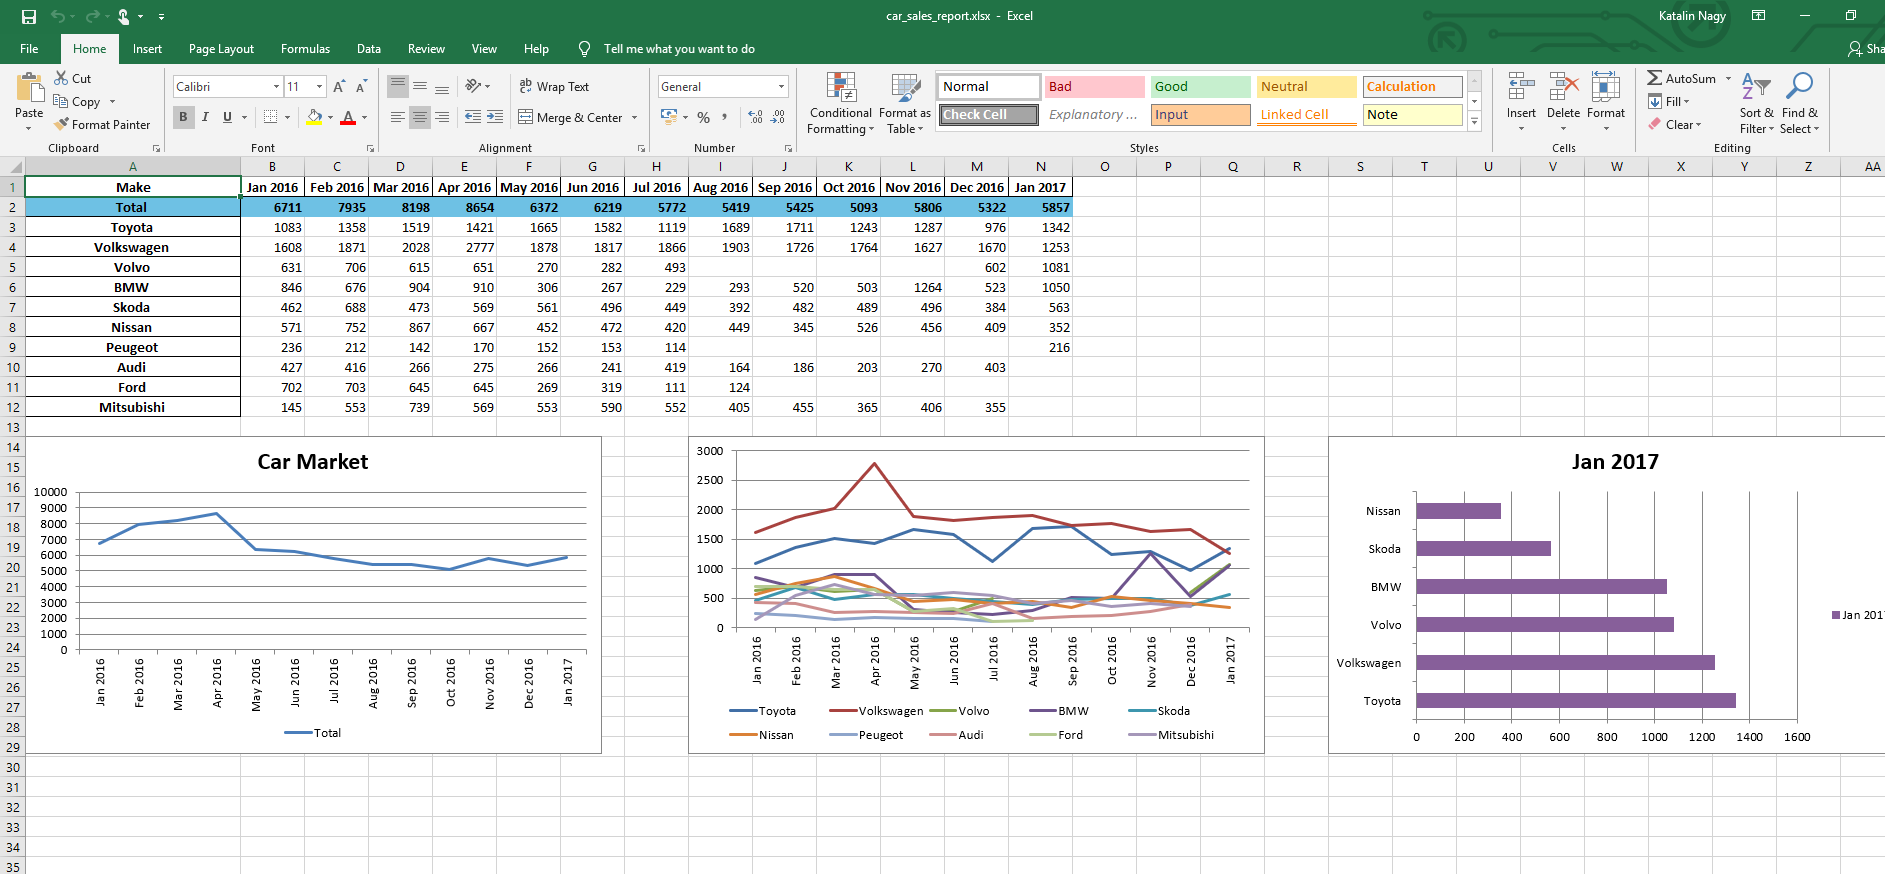
worksheet.insert_chart('A14', chart, {'x_scale': 1.2, 'y_scale': 1.1})

cat_1 = summary_table.index

monthly_sales_chart(1, 2, 'I14')

chart3 = workbook.add_chart({'type': 'bar'})

length = len(summary_table.iloc[2:, [-1]].dropna())

# Configure the first series.
chart3.add_series({
    'name':       summary_table.columns[-1],
    'categories': [brand, 2, 0, 12, 0],
    'values':     [brand, 2, 13, length +1, 13],
    'fill':   {'color': '#875F9A'},
})


worksheet.insert_chart('S14', chart3, {'x_scale': 1.2, 'y_scale': 1.1})
The summary sheet

writer.save()
You can download the Excel report by clicking on the button below
